


 3 / 128

Annual Report 2016 1
FINANCIAL SNAPSHOT
•
Completed the acquisition and
integration of Sirius Resources
NL into the IGO Group
• Released the inaugural
Sustainability Report
• Tropicana Gold Mine celebrated
1 Million ounce milestone
• Completed the Nova
Project Optimisation Study
demonstrating significant value
up-lift
• Rationalisation and
prioritisation of exploration
expenditure for FY16
• First Ore mined in development
at Nova
• Significant investment at
Tropicana Gold Mine to expand
capacity and unlock resource
upside potential
Financial Summary
Highlights
FY16
$M
FY15
$M
FY14
$M
Total revenue and other income
417
499
399
Underlying EBITDA
1
137.5
213
142
(Loss) profit after tax
(59)
77
49
Net cash flow from operating activities
95
202
129
Free cash flow
1
(328)
116
30
Total assets
2,007
820
781
Cash
46
121
57
Marketable securities
5
16
1
Total liabilities
552
155
171
Shareholders’ equity
1,456
665
610
Net tangible assets per share ($ per share)
$2.85
$2.84
$2.62
Dividends per share – fully franked (cents)
2.5
8.5
8.0
Share Price
1
See Notes to Glossary of Terms for definitions
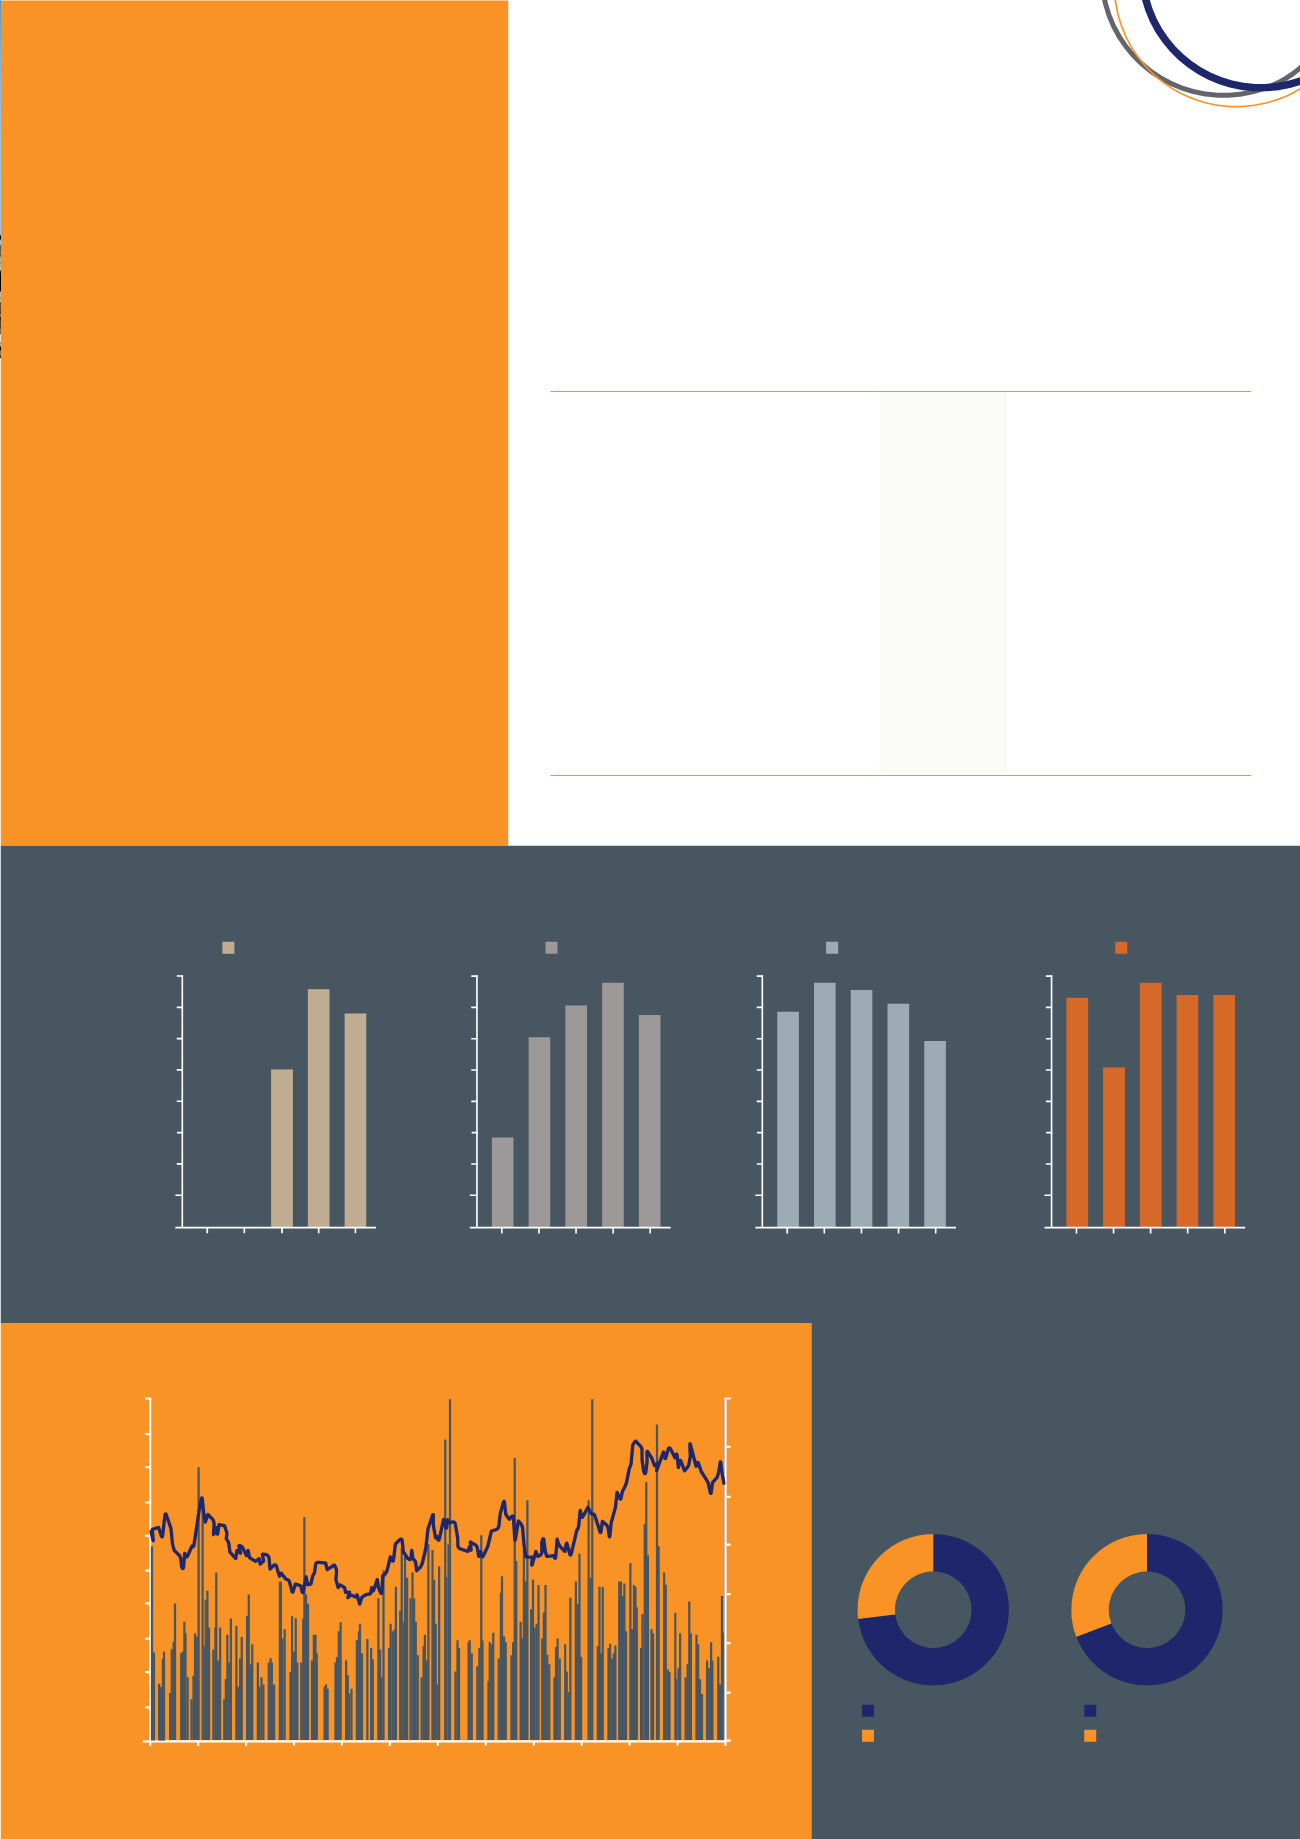
2016 HIGHLIGHTS
IGO HISTORICAL PAYABLE METAL
Zinc (t)
40,000
35,000
30,000
25,000
20,000
15,000
10,000
5,000
-
FY15 FY16
FY13 FY14
FY12
Domestic Instos
International Instos
Nickel (t)
8,000
7,000
6,000
5,000
4,000
3,000
2,000
1,000
-
FY15 FY16
FY13 FY14
FY12
Copper (t)
8,000
7,000
6,000
5,000
4,000
3,000
2,000
1,000
-
FY15 FY16
FY13 FY14
FY12
1
Gold production at Tropicana commenced in FY14
1
As at 7 September 2016
Sep 15
14
12
10
8
6
4
2
-
5.00
4.50
4.00
3.50
3.00
2.50
2.00
1.50
1.00
0.50
-
Oct 15
Nov 15
Dec 15
Jan 16
Feb 16
Mar 16
Apr 16
May 16
Jun 16
Jul 16
Aug 16
Sep 16
Volume (M)
Price (A$)
31%
69%
Substantial Holders
(1)
Mark Creasy 17%
Van Eck
11%
FIL Limited 10%
Ausbil
5%
Institutional Ownership
(1)
Australia
69%
USA & Canada 18%
UK & Europe 3%
Rest
10%
Share Ownership
Instos
Retail & Other
27%
73%
Gold (oz)
160,000
140,000
120,000
100,000
80,000
60,000
40,000
20,000
-
FY15 FY16
FY13 FY14
FY12