


 40 / 128

38 Independence Group NL
DIRECTORS’ REPORT
Directors' report
30 June 2016
(continued)
Operating and financial review (continued)
Cash outflows from investing activities increased during the year to $423.5 million, primarily due to the cash payment for
the acquisition of Sirius ($202.1 million, net of cash acquired) and payments towards the construction of the Nova
Project ($179.5 million). Other movements comprised $10.6 million for capitalised exploration expenditure and $10.7
million associated with acquisition of property, plant and equipment, primarily driven by Tropicana improvement work
aimed at delivering higher plant throughput. The Group also realised $16.0 million from the sale of its investment in Gold
Road Resources Ltd.
On 16 July 2015, the Company entered into a new Syndicated Facility Agreement (Facility Agreement) with National
Australia Bank Limited, Australia and New Zealand Banking Group Limited and Commonwealth Bank of Australia
Limited for a $550 million committed term finance facility on an unsecured basis. The Facility Agreement comprises a
five year $350 million amortising term loan facility that was used to refinance Sirius' existing Nova Project finance
facility, and provide funds for the continued development, construction and operation of the Nova Project; and a five
year $200 million revolving loan facility that was used to partially fund the payment of the cash component of the
Acquisition Scheme and transaction costs, in addition to providing funding for general corporate purposes.
Cash flows from financing activities during the financial year predominantly comprised drawdowns from the debt facility,
which totalled $271.0 million for the period. In addition, the Group paid $12.8 million in dividends during the year. Total
cash flows relating to capitalised transaction costs associated with the Facility Agreement were $5.3 million. These
costs are incremental costs that are directly attributable to the Facility Agreement and include loan origination fees, legal
fees and other costs relating to the establishment of the loan.
During discussions of the operating results of its business, the Group’s Board and management monitor a measure
known as Underlying EBITDA. The Board considers this measure to be important to the Group and investors alike, as it
represents a useful proxy to measuring an operation’s cash generating capabilities. Underlying EBITDA is calculated as
profit after tax adjusted for income tax expense, finance costs, interest income, asset impairments, depreciation and
amortisation. Underlying EBITDA decreased relative to the previous financial year as can be seen in the following chart:
Net profit/(loss) after tax (NPAT) for the year was a loss of $58.8 million compared to a profit of $76.8 million in the
previous financial year. The current year loss includes $65.1 million of acquisition and related integration costs relating
to the acquisition of Sirius, $35.5 million of impairments of capitalised exploration costs (primarily Stockman Project) and
$19.7 million of exploration expenditure. The chart below outlines the key drivers of the results for FY16 compared to
the prior corresponding year.
Independence Group NL
5
Directors' report
30 June 2016
(continued)
Operating and financial review (continued)
Operations (continued)
Jaguar Operation (continued)
Based on current ore reserves, the Bentley underground mine is currently anticipated to have a life of approximately 3.5
years.
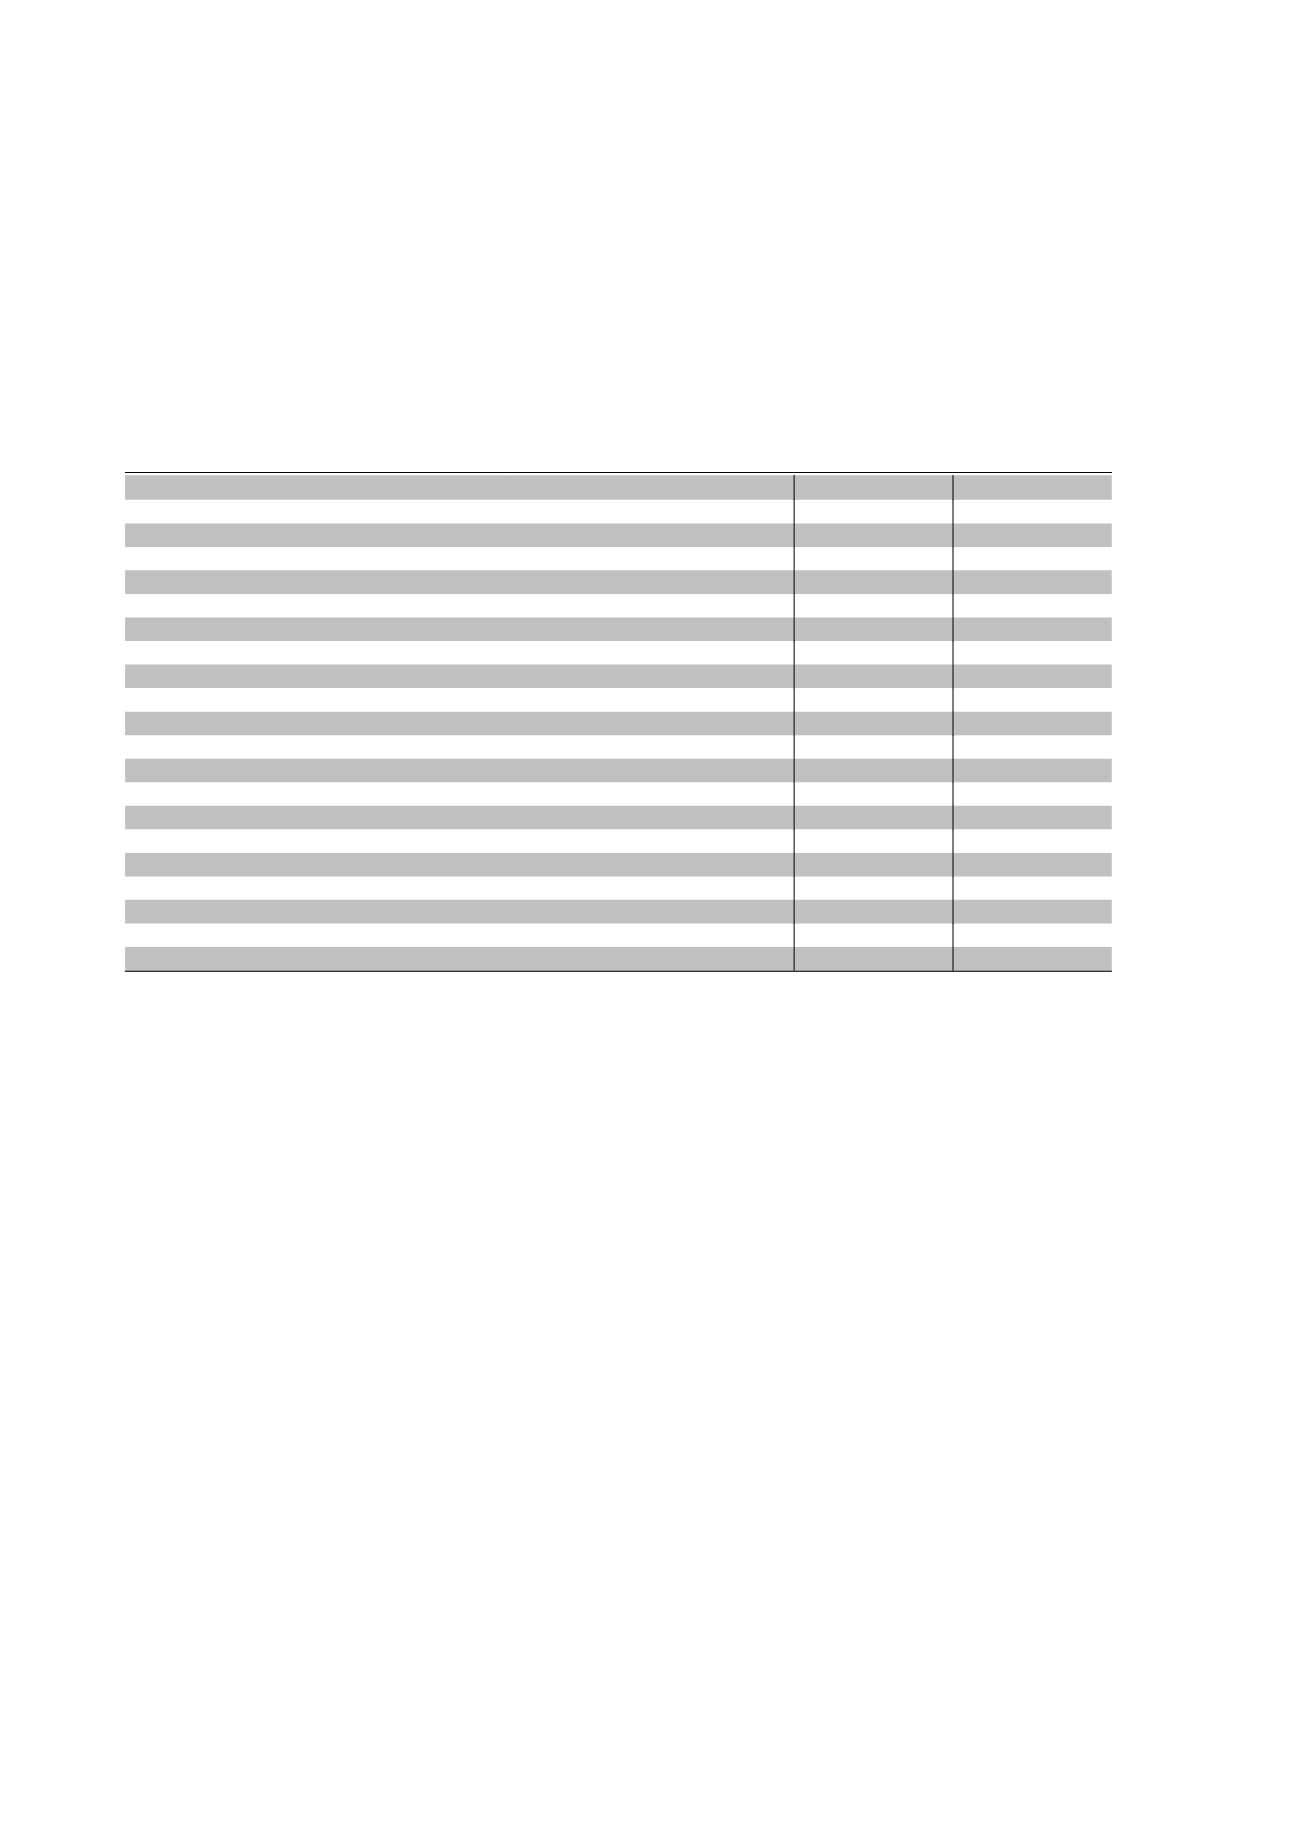
The table below outlines the key results and operational statistics during the current and prior year.
Jaguar Operation
2016
2015
Total revenue
$'000
132,987
164,016
Segment operating profit before tax
$'000
17,317
47,585
Total segment assets
$'000
145,892
134,569
Total segment liabilities
$'000
22,816
24,374
Ore mined
tonnes
497,751
485,302
Copper grade
%
1.7
1.8
Zinc grade
%
8.9
10.6
Silver grade
g/t
128
156
Gold grade
g/t
0.75
0.7
Ore milled
tonnes
505,578
488,466
Metal in concentrate
- Copper
tonnes
7,412
7,380
- Zinc
tonnes
39,335
44,999
- Silver
ounces
1,603,565
1,876,384
- Gold
ounces
4,880
4,439
Metal payable (IGO share)
- Copper
tonnes
7,122
7,090
- Zinc
tonnes
32,634
37,551
- Silver
ounces
1,071,989
1,293,858
- Gold
ounces
4,543
4,110
Zinc cash costs and royalties*
A$/lb total Zn metal produced
0.53
0.43
*Cash costs include credits for copper, silver and gold
The Jaguar Operation also constitutes an operating segment. Segment revenue decreased by 19% during FY16, with
the main drivers of this result being a decrease in zinc revenue of 27% and copper revenue of 20%. This was due to a
combination of 13% lower payable zinc sold and 9% lower realised prices. Copper revenue decreased due to 18%
lower realised prices.
External factors affecting the Group's results
The Group operates in an uncertain economic environment and its performance is dependent upon the result of inexact
and incomplete information. As a consequence, the Group’s Board and management monitor these uncertainties and
mitigate the associated risk of adverse outcomes where possible. The following external factors are all capable of
having a material adverse effect on the business and will affect the prospects of the Group for future financial years.
Commodity prices
The Group’s operating revenues are sourced from the sale of base metals and precious metals that are priced by the
LME. The Group is not a price maker with respect to the metals it sells and it is, and will remain, susceptible to adverse
price movements. The Company took advantage of strong gold price appreciation and hedged additional gold
production during and after the year-end to further de-risk future cash flow during the expected term of the repayment of
the debt used primarily for construction of the Nova Project. Hedging in FY17, FY18 and FY19 represents approximately
70%, 50% and 40% respectively of the Company's share of forecast annual gold production. The average realised gold
price achieved in FY16 was A$1,576/oz.
During the period, the Company initiated diesel hedging in order to benefit from historically low oil prices. As at
year-end, the Company had hedged 25% of expected diesel usage for the next two years.
Independence Group NL
9