


 50 / 128

48 Independence Group NL
DIRECTORS’ REPORT
Directors' report
30 June 2016
(continued)
Remuneration report (continued)
2016 Executive remuneration (continued)
Variable remuneration - STIs (continued)
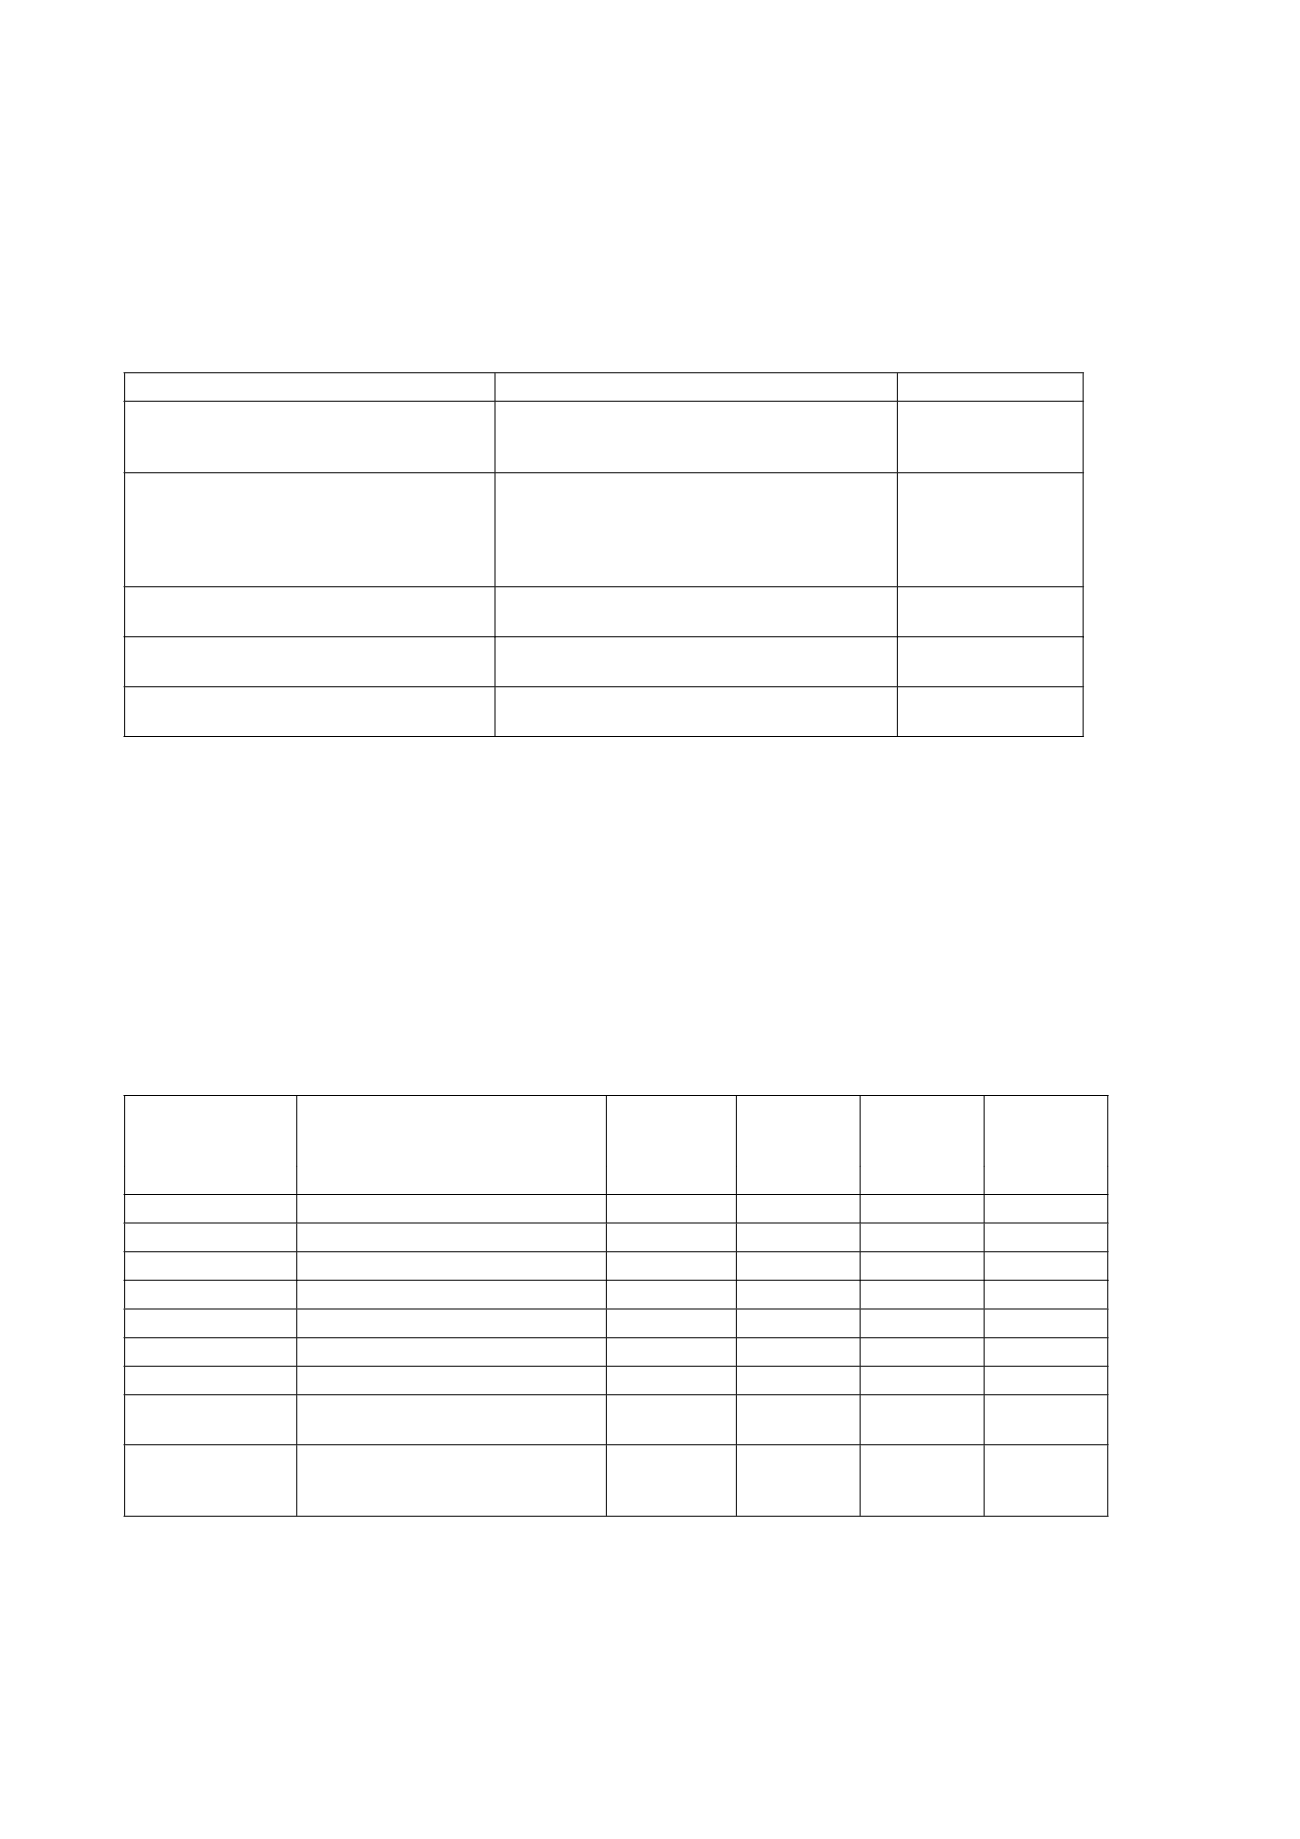
Key Result Area
KPI Measure (in summary)*
Achievement
Operations and financial (17.5%)
Assessed against Group underlying NPAT,
Jaguar and Long production, Jaguar and Long
mine life and Tropicana conceptual studies.
12.5%
Near-term growth (15%)
Assessed against completion of Sirius
transaction, integration of Sirius assets and
people, completion of Nova Project optimisation
study and development timetable and
expenditure. Stretch target achieved.
17.5%
Longer-term growth (10%)
Assessed against measures in line with growth
strategy.
2.5%
Sustainability (7.5%)
Assessed against systems and processes and
ESG measures.
5.0%
Individual KPIs/Personal performance
(50%)
As determined for each individual executive
40-50%
* Due to the sensitive nature of some corporate KPIs the full detail on measures and achievement is confidential.
The KPIs are set and weighted at the beginning of each year and are designed to drive successful and sustainable
financial and business outcomes, with reference to the Company’s strategic plan. The Board assesses and sets the
KPIs applicable to the Managing Director, and the Managing Director assesses and sets the KPIs for each of his direct
reports in consultation with the Board.
The Board determined the KPIs above reflected the key result areas of the business. KPIs related to the operations and
financial, near term growth and longer term growth were chosen as they are key future profitability drivers, the
sustainability of the business is paramount, hence is included as a measure and individual KPIs focus on key
performance elements that align to the Company’s strategic plan and are within the executive’s control.
As a result, STI payments for FY16 to executive KMP were recommended as detailed in the following table, and will be
paid in September 2016.
The following table reflects eligible individual executives’ potential STI components as a percentage of TFR against paid
or to be paid amounts:
FY15
Potential
STI
1
FY15 Paid
2
FY16
Potential
STI
1
FY16
Declared
3
Name
Position
%
$
%
$
Peter Bradford Managing Director
40
270,000
50
280,000
Keith Ashby
Sustainability Manager
-
4
-
30
60,000
Rob Dennis
5
Chief Operating Officer
n/a
n/a
40
120,000
Matt Dusci
Chief Growth Officer
25
90,000
40
120,000
Joanne McDonald
6
Company Secretary
n/a
n/a
30
37,500
Sam Retallack
Organisational Capability Manager
25
35,000
30
60,000
Scott Steinkrug Chief Financial Officer
25
90,000
40
120,000
Brett Hartmann
General Manager, Operations
(ceased 29 February 2016)
25
90,000
n/a
n/a
Tony Walsh
Company Secretary and General
Manager, Corporate (ceased 9
October 2015)
25
75,000
n/a
n/a
1. % of TFR (base salary plus superannuation).
2. Paid in September 2015.
Independence Group NL
19